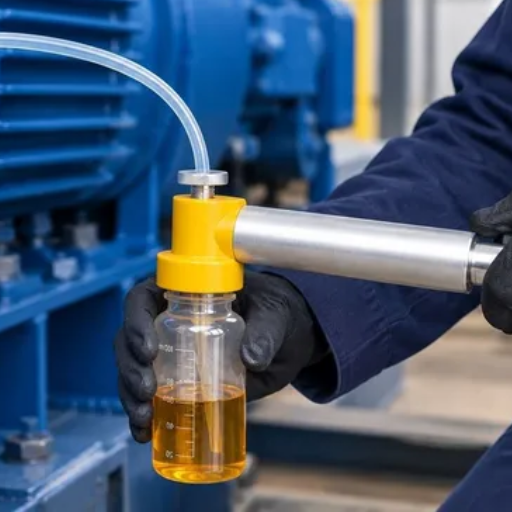
To read hydraulic oil analysis reports, first check which machine and sample they describe. Read the lab’s comments, then compare particles, water, and viscosity with the machine’s requirements and past results. A good particle code alone cannot show that the oil is fit for continued service.
That distinction matters when a report has green boxes beside one test and warnings beside another. The tests answer different questions. Treating them as one overall score can hide the next check you need to make.
This guide explains the fields and which results you can compare. You’ll learn what records to bring to the lab and how to plan the next check. The aim is a sound decision, even when tests seem to disagree.
Key Takeaways
- Check the machine, fluid, sample point, and service history before comparing reports.
- Particle counts describe cleanliness; elemental results add composition information.
- Keep the water method, unit, and temperature with the result.
- Compare viscosity at the same test temperature against the correct oil reference.
- Record what changed, who will investigate, and how the follow-up will be checked.
Verify the context of hydraulic oil analysis reports
Did the machine change, or did the basis of comparison change? Start with the report header before you interpret a red flag. The machine ID, oil product, and sample point help explain the result. Check them before judging the oil.
Read the analyst’s comments next. They explain which result needs attention and what information may be missing. Pall’s annotated report guide puts sample information and recommendations alongside the test data for this reason. Its severity legend belongs to that reporting system; another laboratory may use different labels.
For help with the particle-code field, use our ISO 4406 cleanliness guide. Keep that code separate from the report’s overall assessment.
Match identity, history and test scope
Check these records beside each report:
- Machine and reservoir IDs; oil maker, product and grade.
- Sample date and point; machine hours and oil hours.
- Oil changes, top-ups and filter work since the last sample.
- Collection date and the date the sample reached the lab.
Check whether the test package includes every field you intend to judge. A blank water field means unreported water, not dry oil. An absent viscosity result cannot be replaced by the oil grade printed in the header.
Illustrative scenario: A maintenance team sees a worse particle result after moving its sample point from a circulating line to the reservoir drain. Before calling this a machine trend, the team checks the locations and collection conditions with the laboratory. The new result may still need action. But the team cannot treat samples from different points as a matched pair.
Keep the applicable machine specification beside the report. A laboratory flag and an equipment limit may have different purposes. Ask which reference the analyst used and whether it matches the actual fluid and application. Resolve an uncertain identity before attaching a diagnosis to the wrong machine.
Read particle results without confusing cleanliness and wear
A particle count answers how much contamination falls within measured size channels. It does not identify a failed part. Read the code, raw counts and laboratory comments together, then compare them with the documented cleanliness target for the equipment.
Separate size from composition
The conventional three-channel ISO 4406 code uses cumulative counts at 4, 6 and 14 µm(c). The counts are particles per millilitre. Cumulative means larger particles also fall within the smaller threshold’s count. The channels are not three separate piles of particles to add together.
Use the published code guide for ranges and target selection rather than copying a target from a different machine. Did the lab change its count method or report format? Ask how that affects comparison with past samples. Retain the raw counts where supplied; a code compresses those values into ranges.
MTS’ hydraulic fluid analysis explanation distinguishes particle size information from contaminants and wear metals measured by composition and mass. Its equipment-specific control limits should not become general hydraulic limits. The useful lesson is that these tests complement each other.
Elements on the report may come from wear, dirt, or the oil’s additives. Check the oil blend, machine materials, and history before deciding what the pattern means. A named metal on a report is not, by itself, proof that a particular pump component has failed.
Investigate an unexpected result on the right basis
If particle counts rise, check the sample identity and recent work first. Ask the lab if it should repeat the test or use another method. With the maintenance team, check how dirt could enter and review the filter records. Our hydraulic pump filter guide provides background for that separate inspection.
Do not force the particle result to explain every other field. Low elemental results do not cancel a high particle count, and a cleaner count does not prove that water or viscosity is acceptable. Review the methods and their limits when the indicators appear to disagree.
Return to the changed-point scenario: the question is whether contamination changed under comparable conditions. Preserve both reports and mark the sampling change in the record. Replacing an inconvenient result with a preferred number would erase useful context rather than resolve it.
Interpret water results with the method and unit attached
Water readings need a label. Parts per million, percentage water content, and percentage saturation can look similar in a spreadsheet while describing different things. Never plot them as one continuous series until you have confirmed the basis.
Absolute content and relative saturation
Water content is an amount relative to the oil. For ppm by mass, one ppm means one gram of water per 1,000 kilograms of oil. Is the result by mass or volume? Check with the lab before you convert units.
Relative saturation shows how close the fluid is to the most dissolved water it can hold under the test conditions. At 100% saturation, it has reached that point. This reference does not set a safe limit for every machine.
The distinction matters because fluid composition, temperature, and aging affect the saturation point. Vaisala’s water-activity explanation shows why an unchanged ppm value need not mean an unchanged margin to saturation. Record temperature with a saturation reading and avoid a fixed conversion to ppm without a valid fluid-specific relationship.
Check what the test actually measured
Karl Fischer testing measures water content; ASTM D6304 identifies a coulometric Karl Fischer method used for petroleum products and lubricating oils. The method name does not set the machine’s water limit. If the report is unclear, ask the lab which procedure it used and whether it fits this fluid.
Illustrative scenario: One report lists water in ppm, while a later sensor record lists percentage saturation. A technician initially reads the smaller number as an improvement. The team instead identifies the units, fluid, and temperatures before judging direction. No improvement has been established merely by comparing the printed numbers.
The oil’s appearance can prompt a test. It can’t tell you how much water is there. Also check the fluid family: a hydraulic fluid that contains water by design needs a different assessment. Do not apply a mineral-oil contamination limit to it.
If water exceeds the limit that applies, check how it entered. Agree on a response with the team in charge. Don’t assume particle filtration addresses the water result.
Check viscosity against a fresh-oil reference at the same temperature
Viscosity describes resistance to flow at a stated temperature. Check the test temperature, unit, and oil reference first. Don’t judge a result at 40 °C against a reference at 100 °C.
Match the reference before calculating a change
Reports may give kinematic viscosity in centistokes, abbreviated cSt, or square millimetres per second, written mm²/s. These units are equivalent. The report gives test temperatures. These are not instructions to run the machine at those temperatures.
Use a checked reference for the specified oil product. Include a fresh-oil test if the program calls for one. Does the installed oil match that product? Two oils with similar grade names need not have all the same properties.
If you calculate a deviation, use:
Viscosity change (%) = (used-oil result − reference result) ÷ reference result × 100
Both values must use the same temperature and unit. The formula shows a difference, not a discard limit. Check it against the guidance for this machine and oil. Don’t borrow a percentage from another application.
A change is a finding, not a complete diagnosis
If viscosity changes, review oil additions, the product used, machine history, and other tests. Ask the lab which causes fit those facts. Then agree on what extra check could tell the causes apart. Viscosity alone cannot prove an oil brand or identify a failed component.
The unit-mismatch scenario applies here too. If a maintenance sheet omits temperature, recover the original report before declaring that the oil has thinned. If the fresh-oil reference changed, mark the change in the trend rather than joining unlike results with one line.
For component-specific maintenance context, see our vane pump maintenance guide. Reading the report is only part of a repair decision. The plan still needs the machine’s limits, symptoms, and inspection findings. A viscosity warning deserves a reasoned response, not an automatic conclusion about pump condition.
Read hydraulic oil analysis reports as a trend, not isolated flags
A useful trend connects results to events. Keep the full reports, not just a screen capture of their status colours. Check that the oil, sample point, and methods stayed the same before judging a change.
Build a record that preserves missing information
Use this field map when transferring results into a maintenance log. The comparison reference is as necessary as the number itself.
| Report field | Keep with the result | Compare against | What it cannot prove alone |
|---|---|---|---|
| Particles | Raw counts, code, method, sample point | Documented cleanliness target and comparable samples | Particle composition or whole-oil health |
| Water | Method, ppm basis or saturation, temperature | Fluid-specific requirement and matching history | That another water unit shows the same trend |
| Viscosity | Unit, test temperature, product identity | Correct fresh-oil reference and applicable limits | Exact cause of a change |
| Elements and oil-condition tests | Method, oil formulation, comments | Baseline and service history | A particular failed part from one result |
Do not enter zero for a test that was not ordered. Keep original units and flag a laboratory or method change. Log top-ups and oil changes too. They change the oil mixture in the sample.
The following is an illustrative planning record, not measured customer data or an operating schedule:
| Hypothetical sample | Collection and event context | Test record | Interpretation task |
|---|---|---|---|
| A: 2 September 2026, 1,000 unit hours | Point P; lab L; methods recorded; no top-up logged | Particles, water and viscosity reported | Establish references; record oil hours separately |
| B: 16 September 2026, 1,100 unit hours | Same point/lab; filter change logged; top-up amount unknown | Cleaner particle result; viscosity still outside documented range; water unreported | Investigate viscosity; recover top-up record; do not infer water condition |
| C: follow-up not yet collected | Agreed point and methods; record oil hours and all intervening work | No results available | Define verification before declaring recovery |
Illustrative scenario: After filter work, the team receives the cleaner particle result shown in row B. It cannot close the viscosity finding or describe the whole oil charge as restored. The team must review the improved count on its own merits. Which other checks are still needed?
Read supporting indicators in context
Elemental patterns, acid number, and oxidation results add context if the test package includes them. Use the same oil’s baseline and history. A changed additive-related element alone does not prove the additive is used up. Ask the analyst what supports that conclusion.
Check those findings against the machine log. Our axial piston pump maintenance guide provides a place to continue the component-maintenance discussion without making a laboratory result stand in for inspection.
Turn confirmed findings into a documented next action
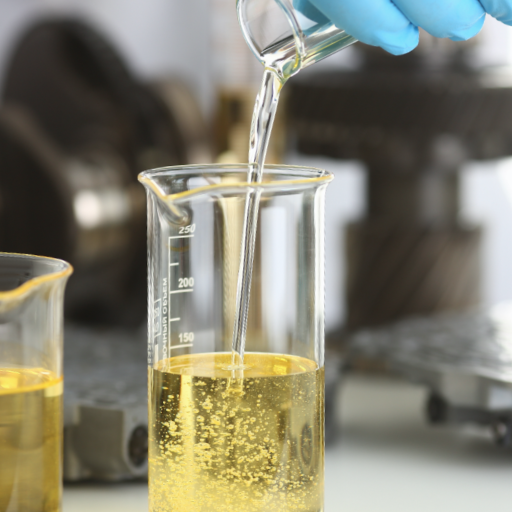
A report becomes useful when someone owns the next check. Separate what was measured, what remains uncertain, and what the team will do. Read the lab’s advice beside the machine’s current condition and the procedures that apply.
Use this matrix to structure the discussion, not as an automatic repair instruction:
| Observed pattern | Do not conclude | Next verification | Responsible role to assign |
|---|---|---|---|
| Unexpected particle increase | A specific pump part failed | Check sample basis, lab comments, entry paths, and filter records | Maintenance lead with laboratory |
| Water warning or unclear water unit | Every fluid needs the same ppm limit | Confirm fluid family, method, units, and applicable requirements | Fluid specialist with laboratory |
| Viscosity outside the documented range | One cause is proven | Check product, temperature, reference, top-ups, and supporting tests | Reliability or maintenance lead |
| Cleaner particles, other tests unresolved | Filtration restored all oil properties | Review each unresolved property and agree on follow-up tests | Maintenance lead with laboratory |
| No result for a needed property | The property passed | Confirm whether the test was included or needs ordering | Program owner |
Agree on the response and the evidence needed to close it
Ask the laboratory a focused question: “Which finding drives this recommendation, what reference applies, and what would confirm the suspected cause?” Supply the previous reports and maintenance log. That discussion is more useful than asking whether the oil is simply good or bad.
The response may involve confirming the sample, investigating contamination entry, checking fluid identity, or planning an intervention. Do not assume one treatment addresses particles, water, and changed oil properties together. Choose the work with the team that owns the equipment. Use the guidance for that machine and fluid.
Do not keep running an unsafe machine merely to collect another trend point. Follow the equipment’s procedures for urgent symptoms or alarms. A later sample can help verify the work; it does not replace an immediate operational decision.
Log the agreed action, owner, timing, and reference. State how you will check the work. Afterward, record what changed and use the same basis to review the next sample. For a gear-pump application, continue with hydraulic gear pump maintenance when planning the component checks.
Keep the machine’s limits in its maintenance record. Close the finding only when the agreed checks support that decision. Another technician should be able to trace the action back to the report and see why the team chose it.
Questions about hydraulic oil test results
Does a good ISO 4406 code mean the oil is healthy?
No. The code describes particle cleanliness within its reporting convention. It does not show water content, viscosity, or full oil condition. Check those tests against their own requirements and read the lab’s comments before deciding whether the oil can remain in service.
Does a low metal result rule out all wear?
No. Read the metal result within the test method’s scope and the machine’s history. It does not replace a particle count or inspection. Ask the lab whether the suspected wear needs another test before using a low reading to dismiss it.
Is water ppm the same as relative saturation?
No. PPM states an amount of water relative to oil on a stated basis. Relative saturation shows how close the fluid is to saturation under the test conditions. Temperature and fluid condition affect the link. Don’t convert between them without support.
What if viscosity was measured at a different temperature?
Find a reference at the same test temperature and in equivalent units. Don’t compare a 40 °C reading directly with a 100 °C value. Ask the lab about unclear labels. A percentage change only helps when the starting values are comparable.
Should every flagged result trigger an oil change?
No. Read the lab’s advice and check what the flag means for this machine and fluid. The response depends on the finding, other evidence, and operating condition. Changing oil alone does not explain contamination entry or prove a mechanical fault is resolved.
Can I compare results after a top-up or sample-point change?
Keep both reports, but mark the event before judging the trend. A top-up changes the oil mixture, and a new point may change the sample’s basis. Give the details to the lab. A lower result alone does not prove recovery.
Use our oil maintenance guide to connect hydraulic oil analysis reports with a wider service plan. Bring the event log so every follow-up has a clear purpose.