Understanding the performance curve of gear pumps is very important for engineers, technicians, and operators working in fluid transfer systems. Being examples of positive displacement pumps, gear pumps find application in almost every industry, with their use ranging from manufacturing to oil and gasoline, all dependent on reliability and precision.
This comprehensive guide will help you understand critical considerations like flow, pressure, and pump efficiency, enabling you to make informed decisions regarding the selection, optimization, and design of pumps and systems.
Introduction to Gear Pump Performance
What is a Gear Pump?
Gear pumps belong to the broad class of positive displacement pumps and are used to convey precisely measured amounts of fluid in industrial, automotive, and chemical applications. A fluid is trapped between the cavities of the rotating gears and is, therefore, transported from the inlet to the outlet of the pump.
There are two main types of gear pumps:
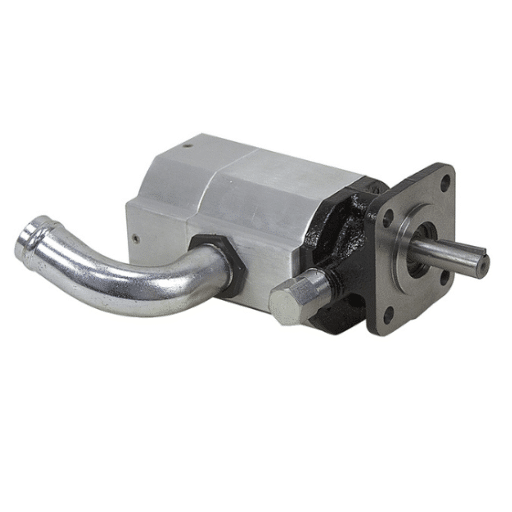
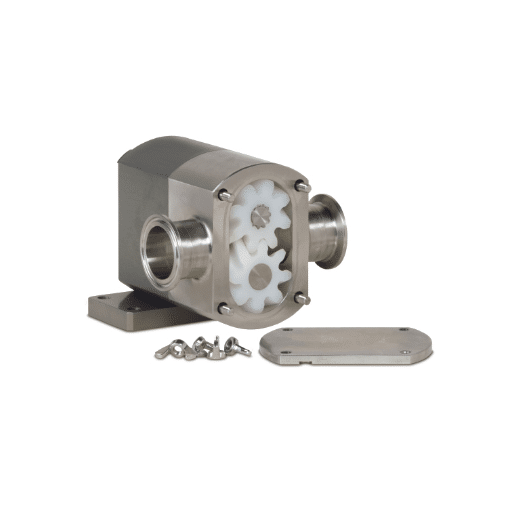
- External gear pumps: Two interlocking gears of equal size rotate opposite to each other
- Internal gear pumps: Small gear interlocks within a larger ring-shaped gear
Importance of Pump Performance
Pump performance is essential as it affects the efficiency and reliability of fluid transfer systems. Poor pump performance causes:
- Energy losses and increased operational costs
- Unscheduled downtime and maintenance
- Reduced equipment lifespan
- Safety and regulatory compliance issues
Overview of Positive Displacement Pumps
Positive displacement pumps move a fixed volume of liquid through the system during each cycle, independent of the pressure present. They guarantee highly accurate flow control, making them useful where precision and consistency are required.
| Pump Type | Mechanism | Best Applications |
|---|---|---|
| Rotary Pumps (Gear, Screw) |
Smooth, continuous rotation | High flow, low viscosity fluids |
| Reciprocating Pumps (Piston-type) |
Reciprocating motion | Low flow, high-pressure systems |
Generating Gear Pump Performance Curves
How Performance Curves are Created
Performance curves for gear pumps are developed through controlled testing under standard conditions. The process involves:
- Installing the pump in a controlled test environment
- Using calibrated test instrumentation for precise measurements
- Measuring flow rates at different pressures and power inputs
- Calculating energy efficiency at each operating point
- Plotting measurement data to display performance characteristics
Key Components of the Performance Curve
A pump’s performance curve consists of several critical parameters:
| Parameter | Symbol | Units | Description |
|---|---|---|---|
| Flow Rate | Q | GPM, m³/h | Volume of fluid moved per unit time |
| Head | H | m, ft | Energy transferred per unit weight to fluid |
| Power | P | kW, HP | Input power required by the pump |
| Efficiency | η | % | Ratio of hydraulic to input shaft power |
| NPSH Required | NPSHr | m, ft | Pressure needed to prevent cavitation |
Factors Influencing Gear Pump Performance

Fluid Viscosity and Its Effects
Fluid viscosity directly influences gear pump performance and efficiency. Here are the key effects:
Critical Impact Areas:
- Flow Rate Variation: High viscosity reduces flow rate due to friction; low viscosity may cause leakage
- Power Consumption: Higher viscosity increases power requirements and energy consumption
- Heat Generation: Increased friction leads to higher temperatures and component degradation
- System Pressure: Viscous fluids require higher system pressures
- Cavitation Risks: Insufficient viscosity can lead to damaging cavitation
Operating Pressure Considerations
Operating pressures place serious demands on pumping equipment. Key considerations include:
- Ensuring pressure ratings of all components meet maximum expected pressures
- Installing accurate real-time pressure monitoring instruments
- Matching operating pressure with pump specifications
- Using CFD simulations to predict pressure distribution
Temperature Impacts on Efficiency
Temperature fluctuations significantly affect system performance:
| Temperature Effect | High Temperature Impact | Low Temperature Impact |
|---|---|---|
| Viscosity Changes | Reduced viscosity, higher efficiency | Increased viscosity, higher energy required |
| Thermal Expansion | Material expansion, potential leakage | Material contraction, seal tightness |
| Cavitation Risk | Lower vapor pressure, higher risk | Higher vapor pressure, lower risk |
| Material Integrity | Potential degradation of seals/polymers | Brittleness in some materials |
Optimizing Gear Pump Efficiency
Maintenance Best Practices
To maintain optimum functioning and extend service life, implement these practices:
Essential Maintenance Tasks:
- Regular Inspections: Check gears, bearings, and seals for wear and damage
- Lubrication Monitoring: Maintain proper lubrication levels and quality
- Condition Monitoring: Track temperature, pressure, vibration, and noise levels
- Thermal Management: Prevent overheating through proper cooling systems
- Fluid Quality: Monitor for contamination and degradation
Proper Pump Selection for Applications
Choosing the right gear pump requires understanding these key factors:
- Fluid Properties: Viscosity, temperature, and chemical compatibility
- Flow and Pressure Requirements: Stay within optimal operating ranges
- Environmental Conditions: Temperature extremes and corrosive environments
- Speed Matching: Align rotational speeds with application needs
- Drive System Compatibility: Ensure proper mechanical matching
Common Applications of Gear Pumps
| Industry | Application | Typical Specifications | Key Benefits |
|---|---|---|---|
| Chemical Processing | Corrosive fluid transfer | Up to 200 GPM, 100-300 PSI | Chemical resistance, precision control |
| Hydraulic Systems | Power transmission | 2000-3000 PSI | Compact size, high durability |
| Oil & Gas | Petroleum product transfer | Up to 150°C (302°F) | High temperature capability |
| Food & Beverage | Viscous food products | FDA-compliant materials | Sanitary design, food safety |
| Paints & Coatings | High-viscosity materials | >100,000 cP viscosity | Pulsation-free flow |
Troubleshooting Gear Pump Performance Issues
Identifying Signs of Wear
Early detection of wear is crucial for preventing costly failures:
- Flow Rate Decrease: Indicates increased internal clearances
- Higher Noise Levels: Suggests vibrations from misalignment or gear damage
- Pressure Fluctuations: Points to worn gears or housing
- Cavitation Sounds: Audible popping from worn inlet ports or seals
- External Leakage: Visible signs around seals and bearings
Recognizing Inefficiency Indicators
Key Warning Signs:
- Gradual underperformance in volumetric output
- Abnormal noise or vibration during operation
- Elevated operating temperatures
- Contamination in hydraulic fluid or lubricant
Strategies for Resolving Performance Problems
Implement these systematic approaches:
- Real-time Monitoring: Deploy advanced sensors for continuous data collection
- Predictive Analytics: Use machine learning for failure prediction
- Regular Calibration: Maintain system component alignment
- Centralized Management: Integrate monitoring in unified platforms